Case Study 1: Translating Science into Story
The Challenge
At Science Magazine, our mission was to communicate groundbreaking scientific research to a broad audience—without sacrificing clarity or complexity. Readers ranged from top scientists to curious students, requiring work that was both visually compelling and scientifically accurate.
The design challenge was to turn complex research and abstract concepts into visually compelling, accurate, and accessible experiences across print, digital, and interactive formats.
My Role
As a Graphics Editor at Science Magazine, I led the design and execution of interactive experiences that brought complex science to life. I worked at the intersection of journalism, visual design, and science—collaborating with writers, developers, and subject-matter experts to create data-driven, scrollytelling features. My role spanned UX and visual design, art direction for illustrations and motion graphics, and cross-functional coordination across editorial, research, and production teams—all while maintaining brand consistency across digital and print platforms.
Data Visualizations & Charts
Created original, research-based data visualizations (bar graphs, line charts, scatterplots, heatmaps) to accompany editorial pieces
Translated raw datasets into clean, mobile-responsive graphics using tools like Illustrator, D3.js (with devs), and Excel
Applied visual hierarchy and color theory to highlight key insights and trends without overwhelming the user
Interactive & Scrollytelling Experiences
Led UX and visual design for award-winning interactive features, including “The Science of Superspreading” and “The History of the Periodic Table”
Developed scroll-based narratives, wireframes, and responsive layouts in collaboration with devs
Merged motion graphics and interactive charts to allow readers to explore complex systems dynamically
Project link- History of the Periodic table
Prokect link - The Science of Superspreading
Scientific illustrations
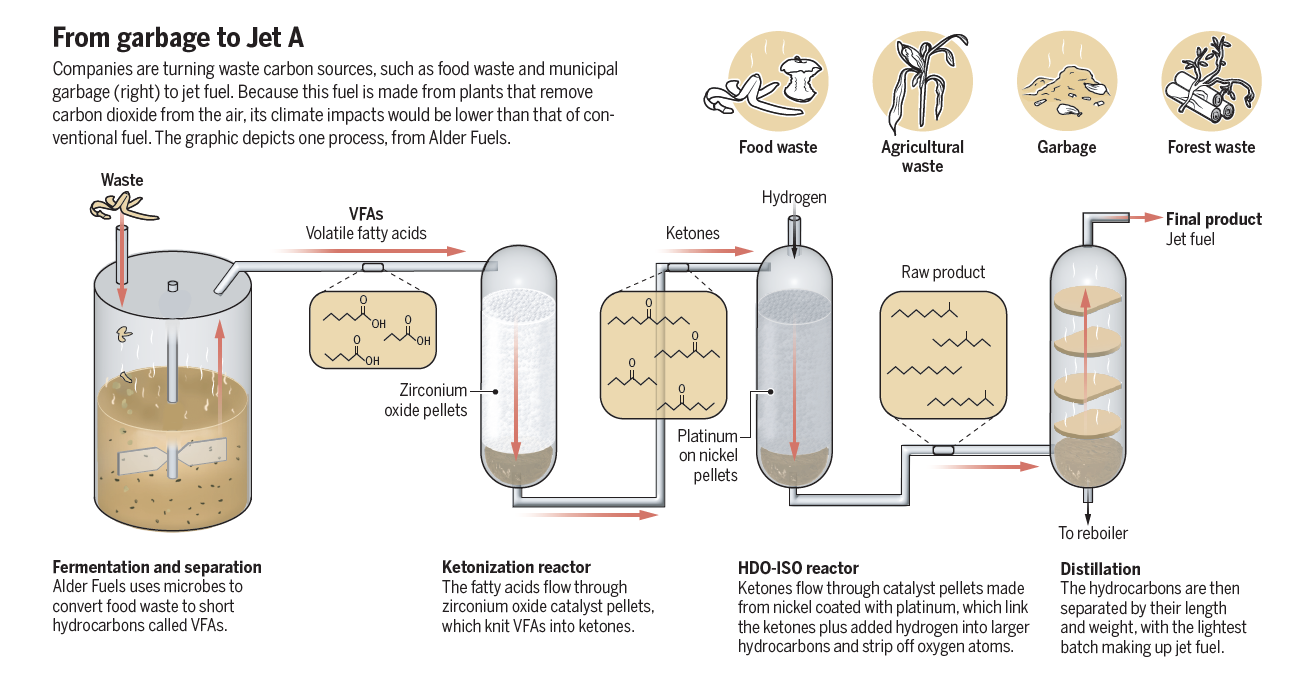
Designed detailed scientific diagrams to explain everything from molecular biology to planetary science
Used illustration to bridge visual gaps where photography or datasets were unavailable
Created visuals that were medically accurate yet visually stylized for audience engagement and clarity
Print & Social Adaptation
Adapted interactive and data-heavy features into static print layouts for the magazine
Designed bite-sized visuals and animations optimized for social platforms to expand reach
Maintained visual consistency and accessibility across all mediums
Process Highlights
Research & Collaboration
Partnered with scientists and writers to distill high-level conceptsSketch to Wireframe
Created flows and visual mockups for stakeholder reviewDesign & Build
Directed visuals and supported dev implementationReview & Iterate
QA’ed across platforms, ensured accessibility and clarity
Cartography and Data Viz created using data
Timeline of the Covid-19
Impact
Boosted engagement and time-on-page across feature articles
Helped expand Science Magazine’s digital audience
Developed reusable visual systems for science storytelling, scientific illustrations and design.
Features shared in classrooms, cited by researchers, and featured in global media
Won multiple awards including Premier Award at Bioimages 2021 by BioCommuniocations Association. Multimedia, Interactive Learning, and Website Division for "The Science of Superspreading". Silver Medal in Digital Design Competition by Society for News Design for Setting the table


